

Spectra
Dashboards you can actually explore — inside Jira.
Spectra turns Jira into interactive dashboards. Click any chart to cross-filter every other widget, and group by derived metrics like cycle time and time-in-status that aren't even Jira fields. No query language, and your data never leaves Atlassian.
Install Spectra Free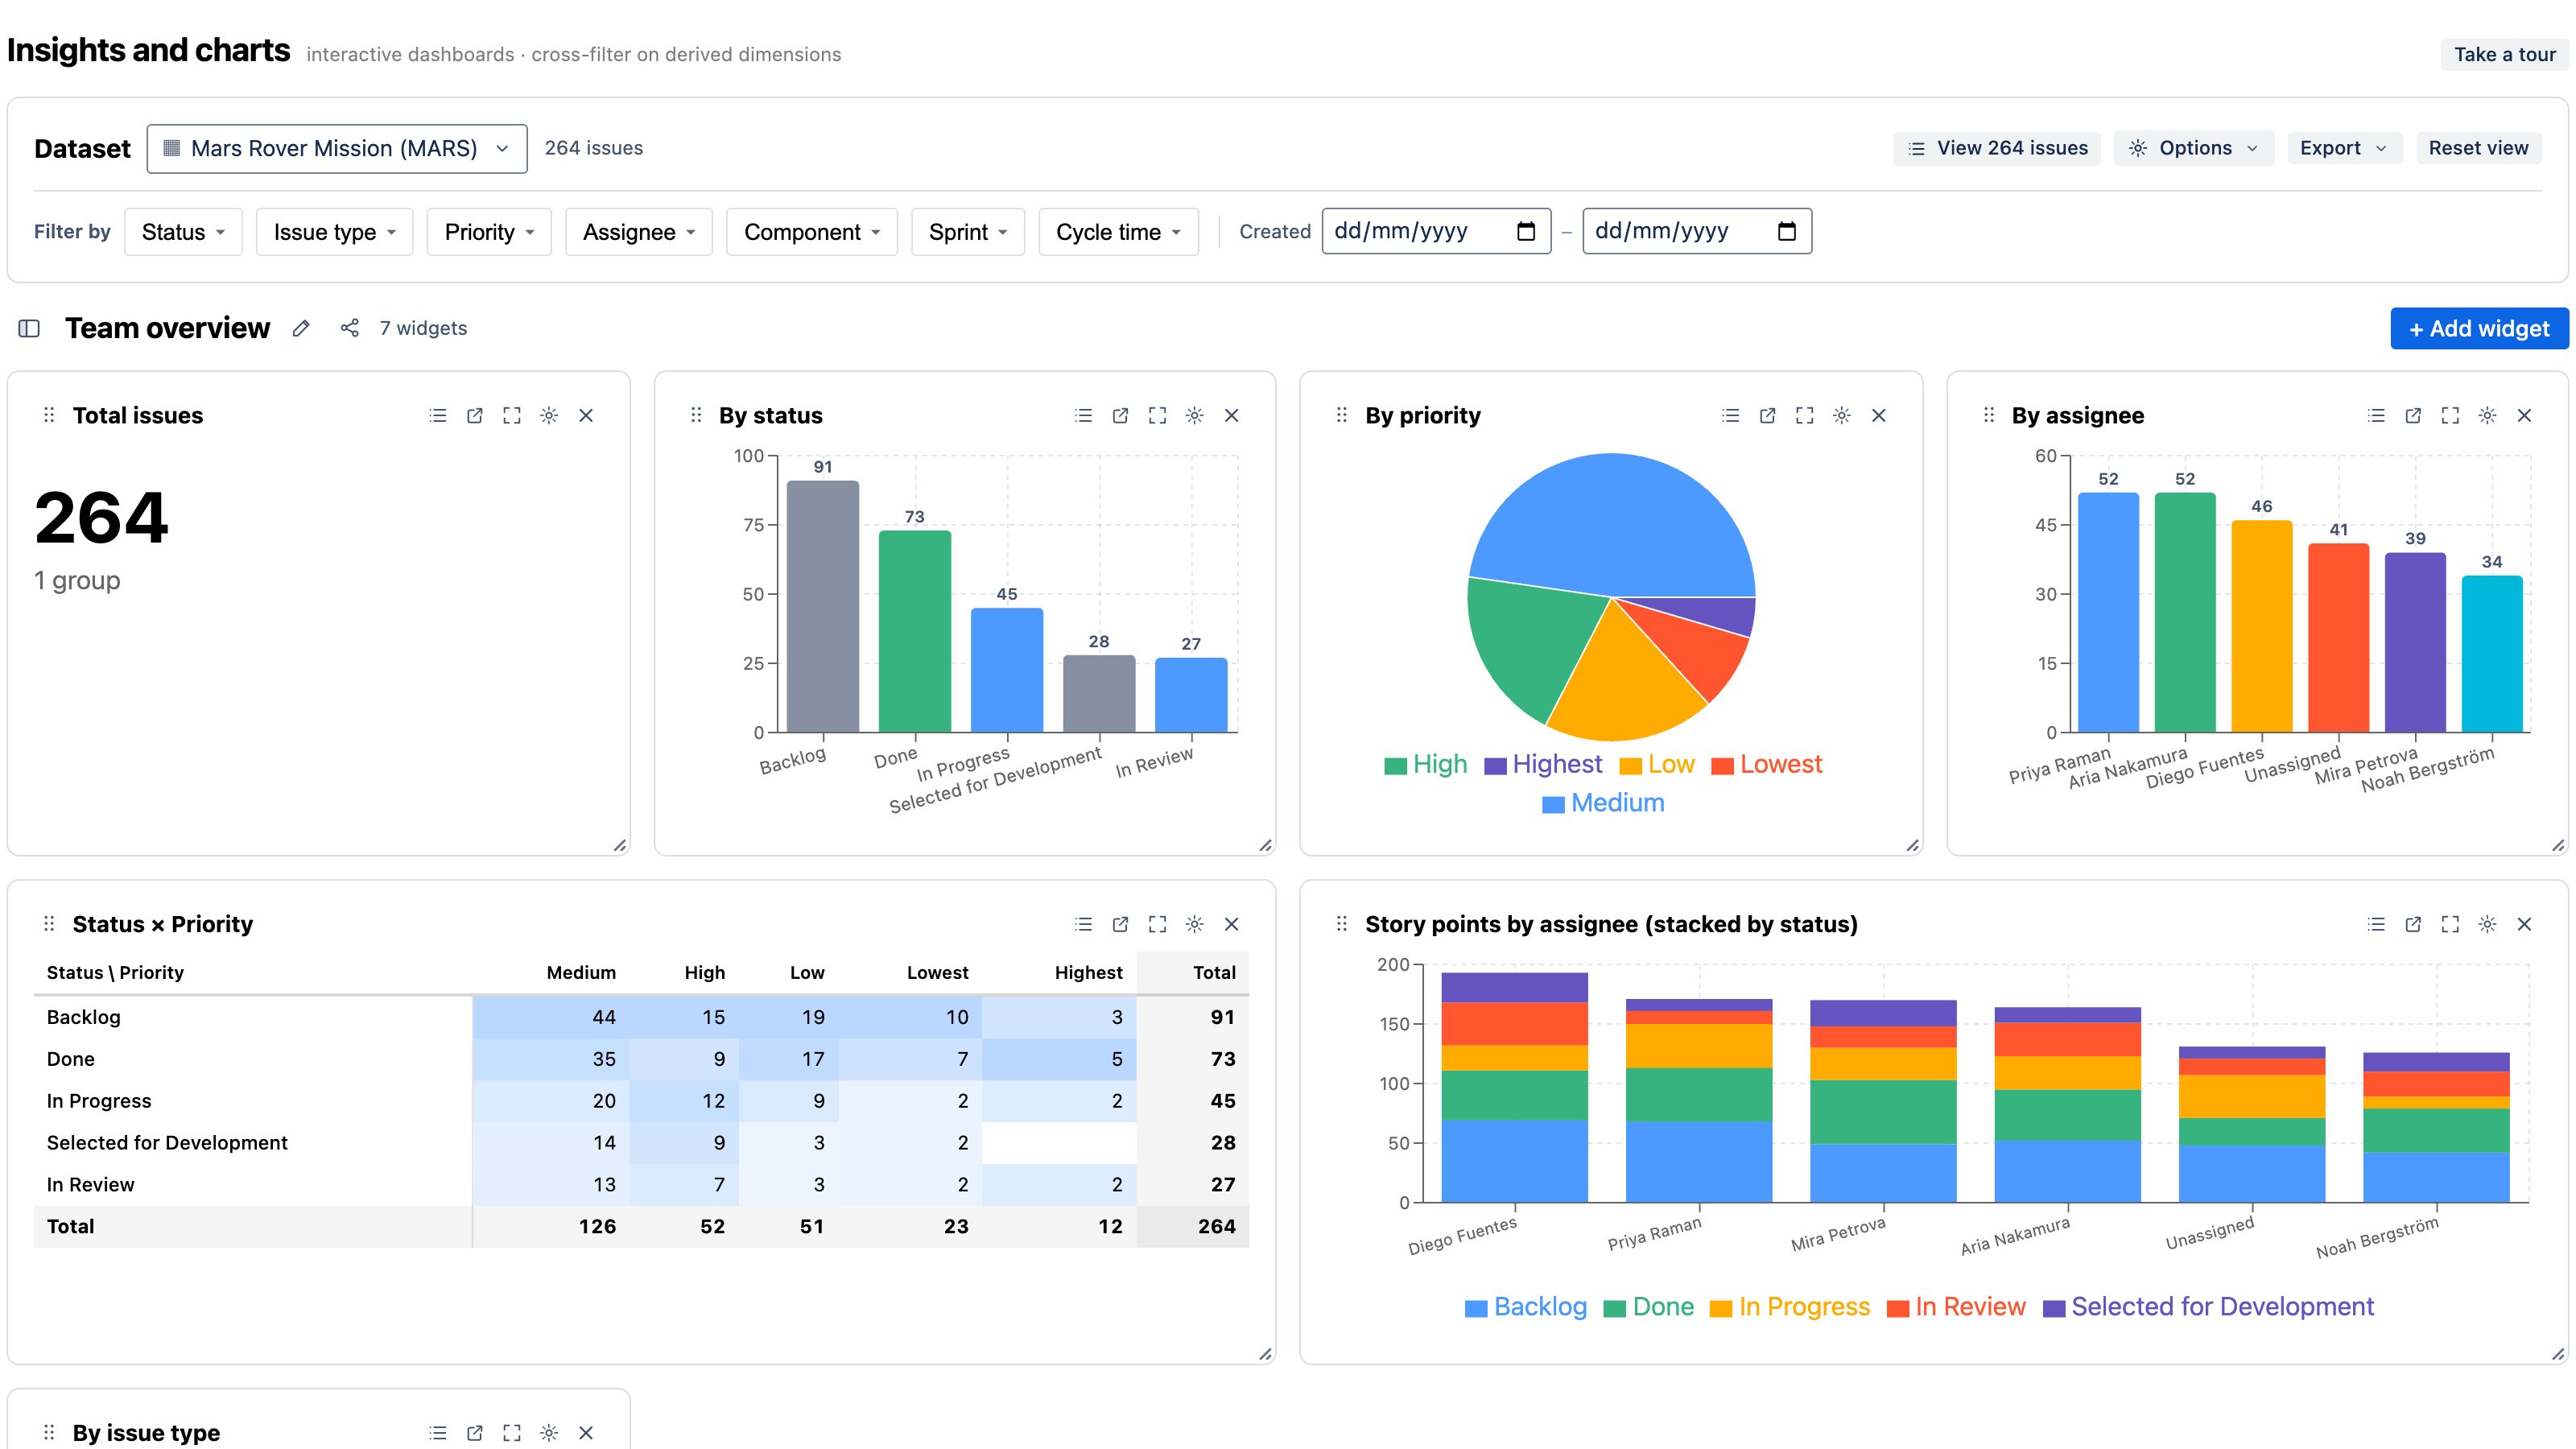
Dashboards you explore, not just read
Every chart is a filter — and the metrics that matter most aren't even Jira fields.
Click to cross-filter
Every chart is a filter.
Click a bar, a pie slice, or a pivot cell and the whole dashboard refilters to that selection. Click again to clear, or multi-select to drill in.
It's linked brushing — answer "of the blocked work, who owns it and how long is it taking?" in three clicks, no query required.
Derived metrics
Chart the metrics Jira doesn't store.
How long did work take? How long has it been stuck? Spectra computes cycle time, time-in-status, WIP aging, SLA state and reopens from change history and lets you group, bucket, and trend them like any field.
Median and percentile KPIs, a control chart with p50/p85 lines — the flow metrics teams actually ask for, with no formula language.
Build any chart
From question to chart in seconds.
Choose a chart type, set what to group by and measure, and you're done — or start from a ready-made recipe and tweak it.
15+ chart types: bar, pie, line, stacked area, control chart, KPI, gauge, pivot, activity calendar, and a dependency matrix no other gadget offers.
Point it at anything
Any project, board, filter, or JQL.
Build on a project, an agile board (for velocity and burndown), any saved filter, or custom JQL with autocomplete.
Cross-project? Point at a saved filter that spans them — every widget aggregates across the whole scope.
A dashboard for every question you get asked
Start from a one-click template, then make it your own.
Team overview
Issues by status, assignee, type, and priority — every chart cross-filterable.
Cycle time & flow
A cycle-time distribution, a control chart with p50/p85 lines, and lead-time KPIs.
Time in status & WIP
Where work waits, how long it has sat in its current status, and reopened issues.
SLA & aging
% within SLA, breach counts, and SLA state by priority against your target.
Flow history
Open issues over time and a cumulative flow diagram reconstructed from change history.
Velocity & burndown
Committed vs. completed per sprint, and a sprint burndown from your board.
Epics & story points
Epic progress, % done, and story points by assignee or epic.
Components & teams
Component × priority and workload split across teams.
Dependencies & blockers
What's blocked, blocker aging, and a dependency matrix of group × group.
Built for everyone who asks "how's it going?"
One dashboard, an answer for every seat at the table.
Delivery leads
Cycle time, WIP aging, and flow — see where work actually slows down, then click in to the issues.
Scrum masters
Velocity, sprint burndown, and a cumulative flow diagram from your board — no spreadsheet exports.
Engineering managers
Workload by assignee, blocked work, and a dependency matrix across teams and components.
Stakeholders
A live, shareable view of status and progress — filtered to exactly what they care about.
What makes Spectra different
The hard parts of a Jira charting app, built in from the start.
Click-to-cross-filter
Every chart is a filter — click a segment and the whole dashboard refilters. Linked brushing, not a separate controller gadget.
Derived metrics, no formula language
Group by cycle time, time-in-status, WIP aging, SLA and reopens — computed from change history, with no MDX or scripting.
Runs on Atlassian
Pure Forge — no external servers and no data egress. Your issues, history, and dashboards never leave Atlassian.
Advanced stats out of the box
Median, p75 / p85 / p90, moving averages, and trend & target lines — without writing a single formula.
Exact counts at any scale
Counts read from Jira's own index, so dashboards stay accurate on large projects instead of sampling.
A gadget and a full page
Use the native dashboard gadget, the full-page app, or both — and cross-filter across gadgets on one Jira dashboard.
Aggressive pricing, on purpose.
Free for up to 10 users, then $0.50 / user — and $0.25 at scale. Most comparable Jira dashboard apps run $1–3 per user.
You pay
$20.00 / month
≈ $0.40 per user / month effective
1 – 10 users
Free
11 – 1,000 users
$0.50 / user / mo
1,001+ users
$0.25 / user / mo
Annual billing 16% off. Forge / Jira Cloud only. Final Marketplace tier pricing may vary at smaller tiers — see the listing for the exact tier table.
All features at every tier — no add-ons, no per-seat-of-pain pricing. Billed per user / month through the Atlassian Marketplace.
Frequently Asked Questions
Does Spectra work with Jira Cloud?
Yes — it's an Atlassian Forge app and runs exclusively on Jira Cloud.
Does my data leave Atlassian?
No. Spectra is pure Forge — there are no external servers and no data egress. Your issues, history, and the dashboards you build stay inside Atlassian's infrastructure.
How are cycle time and time-in-status calculated?
From each issue's change history, replayed into precomputed, indexed values and refreshed daily — so charts read precomputed metrics rather than re-deriving them on every load. No MDX or formula language required.
How is it different from a normal Jira chart gadget?
Two things: you can click any chart segment to cross-filter every other widget on the page, and you can group by derived metrics — cycle time, time-in-status, WIP aging, SLA, reopens — that aren't Jira fields. Most gadgets can only chart fields that already exist on the issue.
Can I put these charts on a normal Jira dashboard?
Yes. Spectra ships a native dashboard gadget you can add to any Jira dashboard, and it can cross-filter the other Spectra gadgets on that page.
What can I build with it?
Team overviews, cycle-time and flow analysis, time-in-status and WIP aging, SLA and aging, cumulative flow diagrams, velocity and sprint burndown, epic and story-point progress, and dependency and blocker views — each available as a one-click template.
When can I get it?
Now — Spectra is live on the Atlassian Marketplace. Install it free for up to 10 users, pick a template, and point it at your project.